This post is a part of Made @ HubSpot, an internal thought leadership series through which we extract lessons from experiments conducted by our very own HubSpotters.
Acquisition marketing campaigns are critical to bring in new customers and revenue. At HubSpot, we run these campaigns quarterly.
Despite the rapid cadence, every quarter we work to create new, remarkable ways of reaching, informing, and converting our audience.
I wrote this post to share with you how we crafted our latest acquisition campaign to hit and exceed our acquisition targets.
Establishing the Campaign
The beginning of our Q1 2020 Acquisition Campaign started with a blinking cursor. As we brainstormed how to start our research, we had a few inputs to work with.
First, we knew our target audience consisted of marketing managers, as we were re-launching our Marketing Hub Enterprise product that month.
We knew that reports were a content type that worked well for us in the past. We saw our 2019 Instagram Engagement Report and a 2020 Social Media Report successfully attract new audiences.
At the very least, it was a motion that our audience was familiar with, which meant there was less of a barrier to show the value.
Additionally, seasonality played a large role in our planning. We wanted to build content to support marketers planning their strategies for the upcoming year.
With the combination of 1) a target audience, 2) an understanding of high-performing content types, 3) timing, and 4) our additional user research, we wanted to create a remarkable go-to resource for marketing managers building their strategies for the year.
Thus, the idea for “Not Another State of Marketing Report” was born.
In this article, I’ll talk through the report surveys and content, the web experience, the promotion, and the results. Hopefully, it gives you a peek behind the curtain and some inspiration for future campaigns.
Running the Surveys and Creating the Report Content
The first and most important thing about the content of this report was to start collecting survey data for analysis and visualization.
Working with our team at HubSpot Research, we ran our first survey in November/December of 2019 that went out to 3,400 global marketers.
After we sent out the survey, we talked about what might differentiate this content from other reports we had released in the past. While the data was valuable, we knew that data can be dull without human context or insights.
So, we brought in the humans.
Our first criterion for selecting our experts was their subject matter expertise. We had come up with a list of topics we wanted the report to cover (from SEO strategy to content marketing strategy and more) and wanted our experts to have deep and specific knowledge about the topic we chose them to represent.
Our second criterion was seniority. We were crafting a report for higher-level marketing managers, directors, and VPs, so we wanted our experts to have a similar level of seniority.
We are fortunate enough to work with a lot of brilliant marketers at HubSpot, so eight of our experts were internal. The other two, Cynthia Price (VP of Marketing at Litmus) and Ellie Mirman (CMO at Crayon) were generous enough to offer their time when we asked them to share their expertise with us.
We interviewed each of our experts for about an hour, took detailed notes, and recorded the interview. We also shared the survey data with them to gather their commentary about the data points. Finally, we worked with the experts to craft detailed articles with their advice for the upcoming year.
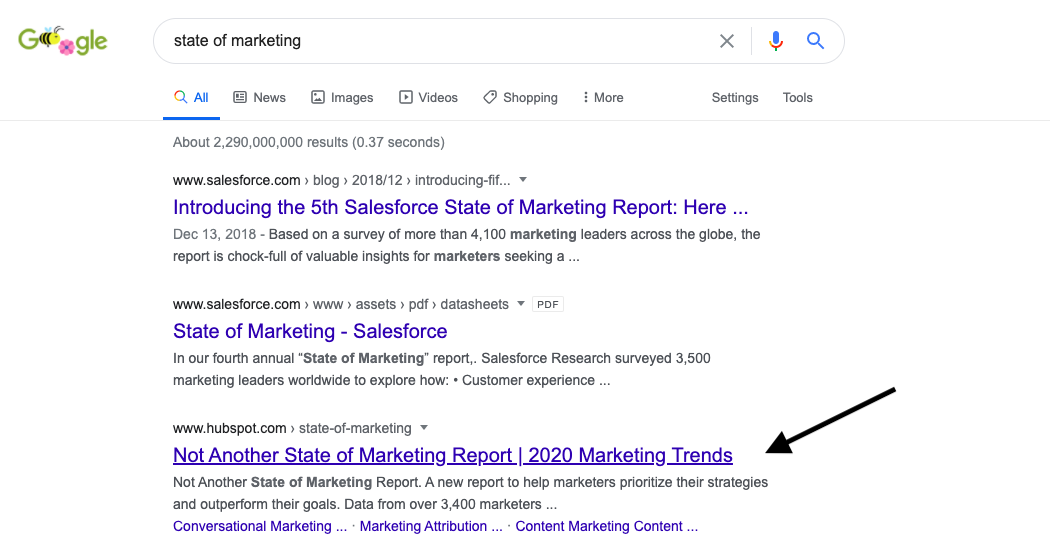
We decided to leave these articles ungated on the web experience, so we optimized them for organic search with extensive keyword research. We’ve seen some exciting results from that play — generating over 15,000 backlinks in the first two months and taking the number three result for the search term “state of marketing”.

When we received the initial survey data, we were thrilled by the results — but knew we needed to take it one step further. So, we ran an additional survey in January to a North American database of marketers.
At this point, with the additional survey data and expert commentary, we sourced some quotes from experts across the industry. We ended up with a great group of contributors from Dropbox, Twilio, and more.
When all was said and done, we had 19,000 words worth of insights and 70+ data points.
Designing and Developing the Web Experience
Differentiating this campaign didn’t stop at the expert insights. We wanted to create an immersive web experience to pair with the report PDF.
The result was a fully custom web experience with a homepage, nine child pages for each article, and custom interactive form that follows the user in a non-intrusive banner. It was designed by an incredible lead designer, and built from the ground up by three developers. (It’s better seen than described, so I’ll leave you with this.)

We were curious about what kind of conversion rates this custom web experience could drive.
To date, the homepage of the report is converting at around 35%. This metric is calculated as the ratio of views vs. submission and is measured in HubSpot’s own HubSpot portal.
We’re really excited about that conversion rate, but we’ve noticed that it doesn’t stay as high throughout each page of the web experience.
For example, on a sample article page, we noticed the conversion rate was about 5%. The leading theory right now is that people are downloading the offer when they land on the homepage, and then they explore the rest of the experience after downloading, so they aren’t converting on the offer pages.
Overall, though, we’re very proud of how the web experience turned out and think it’s a strong differentiator. After all, 38% of people will stop engaging with a website if the content doesn’t look pretty on the page.
How We Promoted the Campaign
When it came time for promotion, we had to decide on three things: the story we wanted to tell, our creative promotional assets, and the channels we wanted to pursue.
1. The Story
The literal offer that we were marketing was a report. However, the emotion that we wanted to portray was confidence. This was the story we wanted to report and campaign to tell.
For some marketing managers, feeling confident about a strategy can prove difficult. Are other people in the industry doing this? How will I know if it will work?
Data can help ease those concerns, as can long-form articles from deep subject matter experts.
So, we wrote 20 headlines around that concept. This was a good exercise because, although most of them ended up unused, we found this process sharpened our writing “muscle”.
One of the early headlines we landed on was, “A report for marketers who use data to outperform their goals.”
2. Our Creative Assets
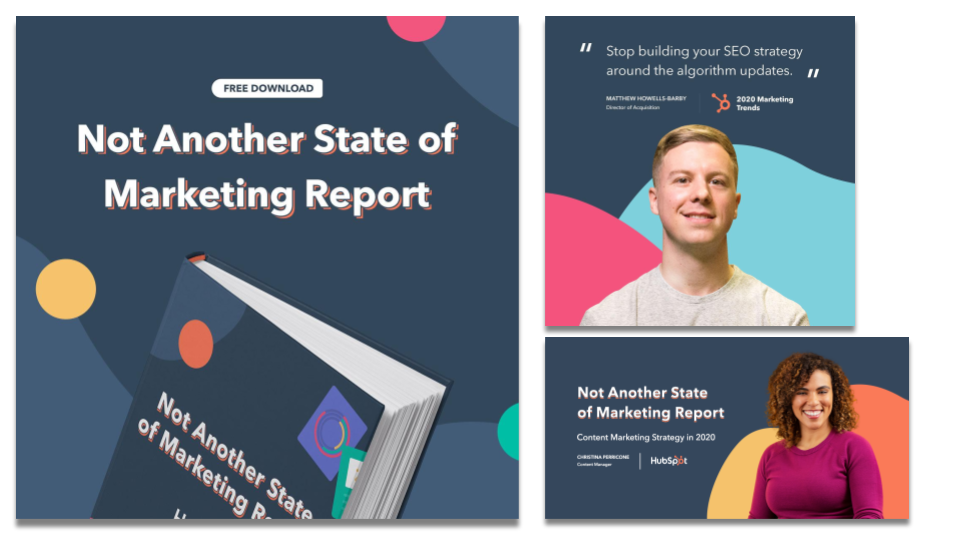
The design of this campaign was important to us. We wanted it to feel cohesive across the web experience, the PDF offer itself, and our promotional efforts.
So, under the guidance of our lead designer, we put together a detailed brief for a freelancer, and he came up with some beautiful stuff.

Our learning here is that cohesive design across all campaign assets makes the campaign feel larger than life.
3. Promotional Channels
On the Global Campaigns Team here, we like to bucket our promotion into three categories:
- Paid : What channels can we activate that we have to put direct dollars into?
- Owned: What organic channels and established HubSpot audiences can we leverage?
- Earned: What are some additional free promotion and placements (e.g. organic SEO) can we leverage?
For our paid channels, we chose to focus on Facebook Ads (historically the lowest CPL for us) and LinkedIn Ads (typically more expensive but more effective targeting for the audience we wanted to attract). For this channel, we built a more standard landing page to drive conversions.
For our owned channels, we activated our brand channels (social media, email, etc.), our solutions partner channels, our customer channels, our HubSpot Academy Channels, and Sales Channels (our BDRs used the report as a conversation starter). We also asked our authors to promote it on their personal social networks, and we gave them personalized assets to make that promotion remarkable.
For our earned channels, we focused heavily on the organic SEO value of our ungated articles, the promotion from our partners in the report (Litmus and Crayon), and media placement in marketing publications.
Tracking and Analyzing the Results
This campaign was quickly successful: We hit 100% of our net new lead goal in 16 days and 150% of the goal in just over one month.
As of April 21st, there are 15,800 backlinks to the report. We are ranking for over 350 organic keywords and secured the #1 result for the search term “state of marketing.”
The custom homepage is converting at over 30%, and the paid landing page is converting at 25%.
About 50% (48%) of the net new leads for the campaign came from paid social media. We are hoping to see that percentage decrease as organic traffic continues to gain traction.
There were a lot of factors to our success, but we’ve identified the following as the main ones:
- Spend time in the strategic planning process. It’s tempting to rush a campaign out the door, but a well thought out strategy goes a long way. Use qualitative, quantitative, and search data to inform the direction you choose.
- Think about how you can contribute to a conversation that’s already being had in a new way. There are a lot of State of Marketing Reports out there. We focused on providing that same value but took it a step further.
- Help your creative team by giving them strong creative guidelines. This makes the design more cohesive and powerful in the end.
- Identify at least three channels you can activate for promotion. You should prioritize the ones that will most help you with your goal. Since we were looking to attract a new audience, our paid channels made the most sense to invest in.
- Double down on the details of your content. If someone is willing to give their information for your content, you better make sure it delivers on value.
Best of luck with your future campaigns!
No comments:
Post a Comment